Analysis
made clear
Acova delivers visual assessment that is consistent, verifiable and free from operator bias.
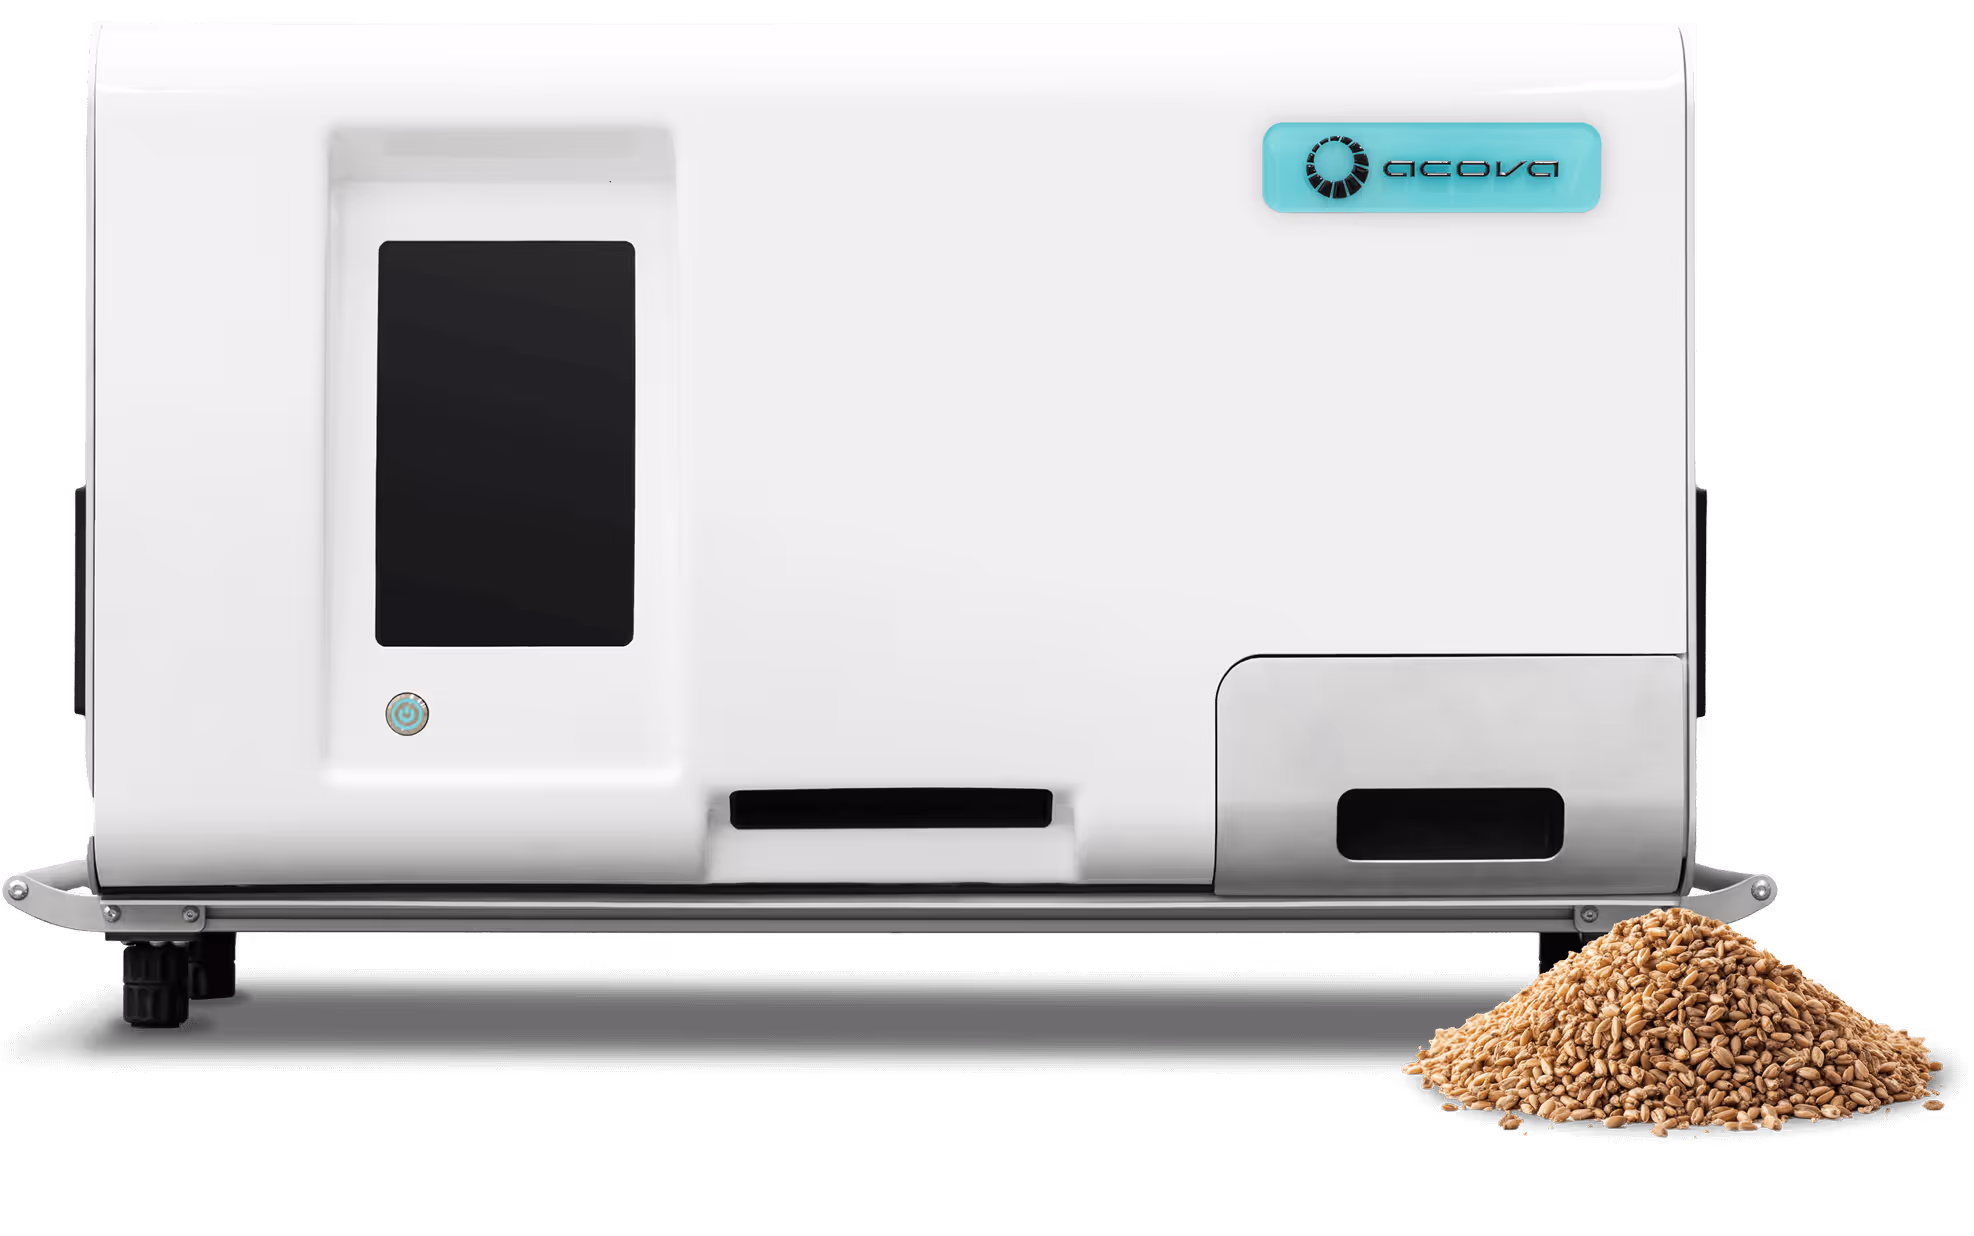
OUR INNOVATION
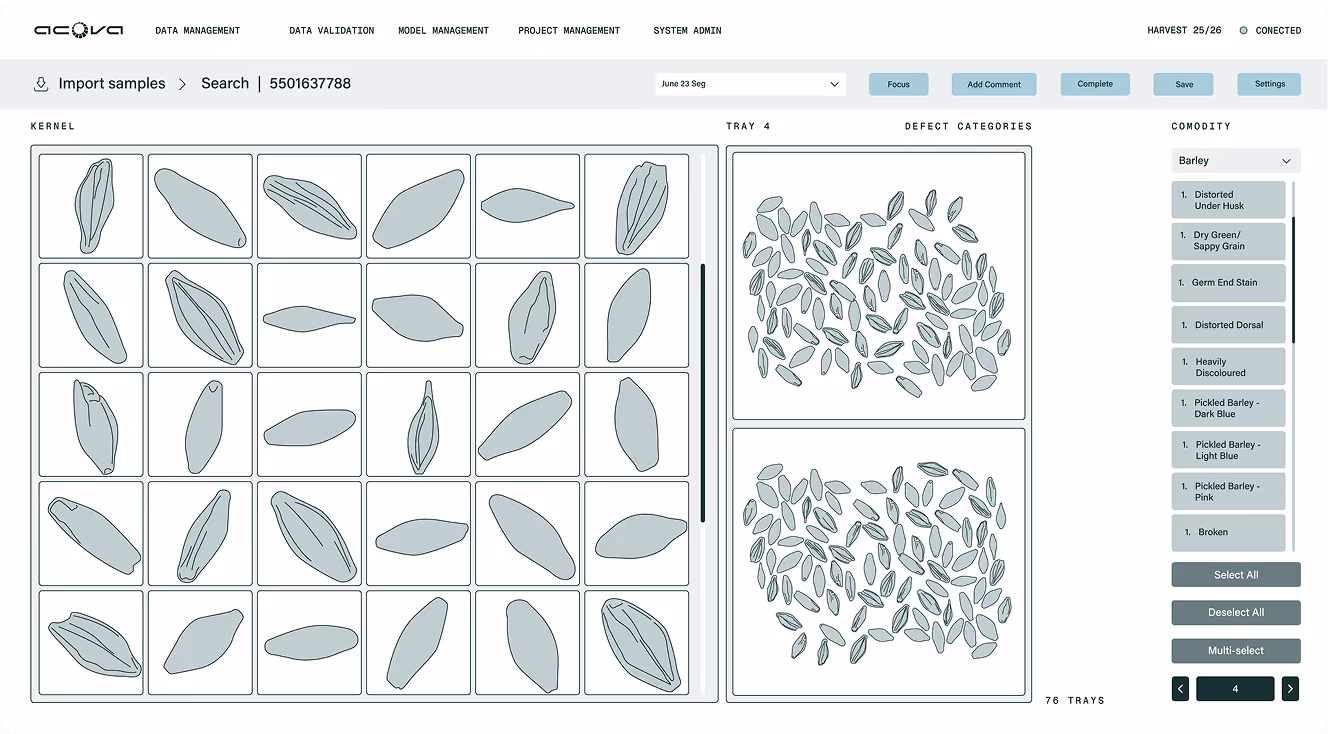
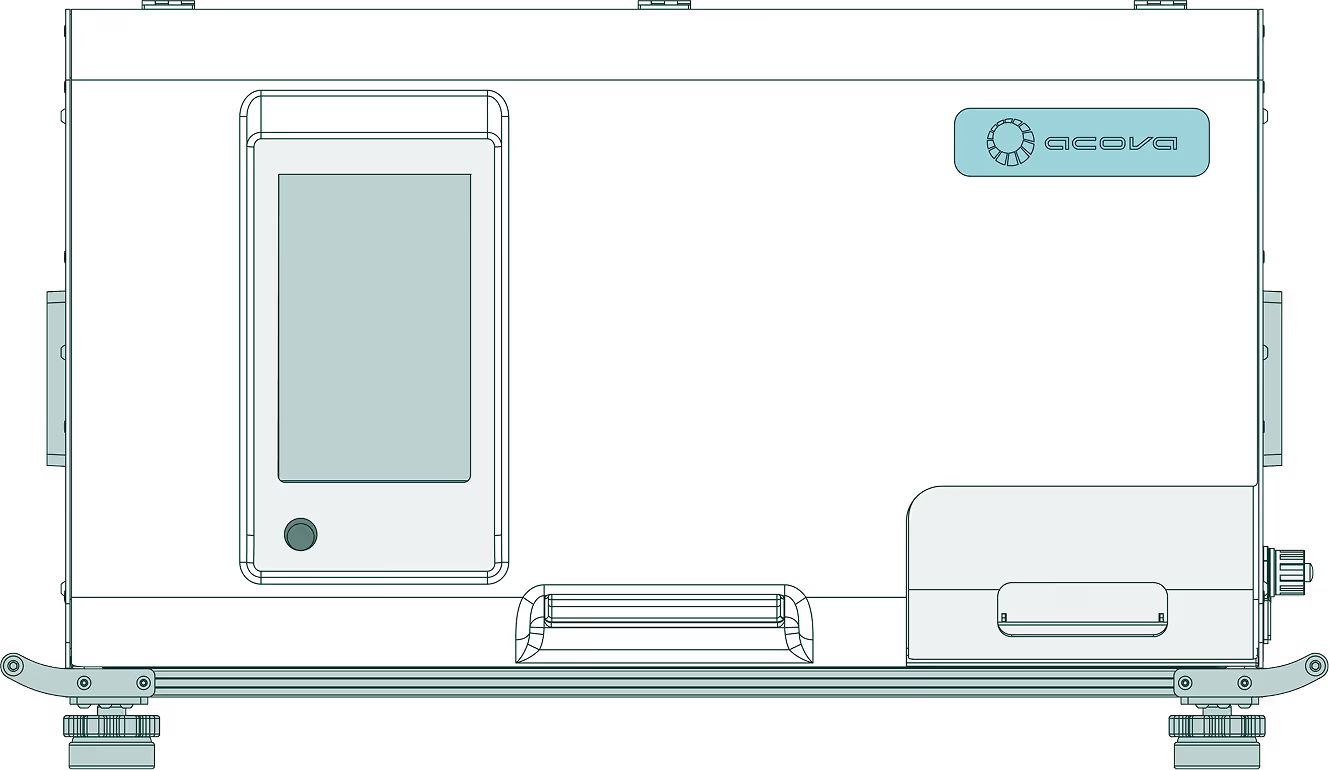
The Acova Visual Analysis Device removes subjectivity from commodity testing. Compact in size, it processes a full industry sample in minutes. Each sample is captured from both sides and assessed against recognised standards, delivering results that are reliable and repeatable.
20X
More grain analysed (for select defects)
43kg
Compact bench-top unit
10,000+
Kernels processed in under 2.5 minutes
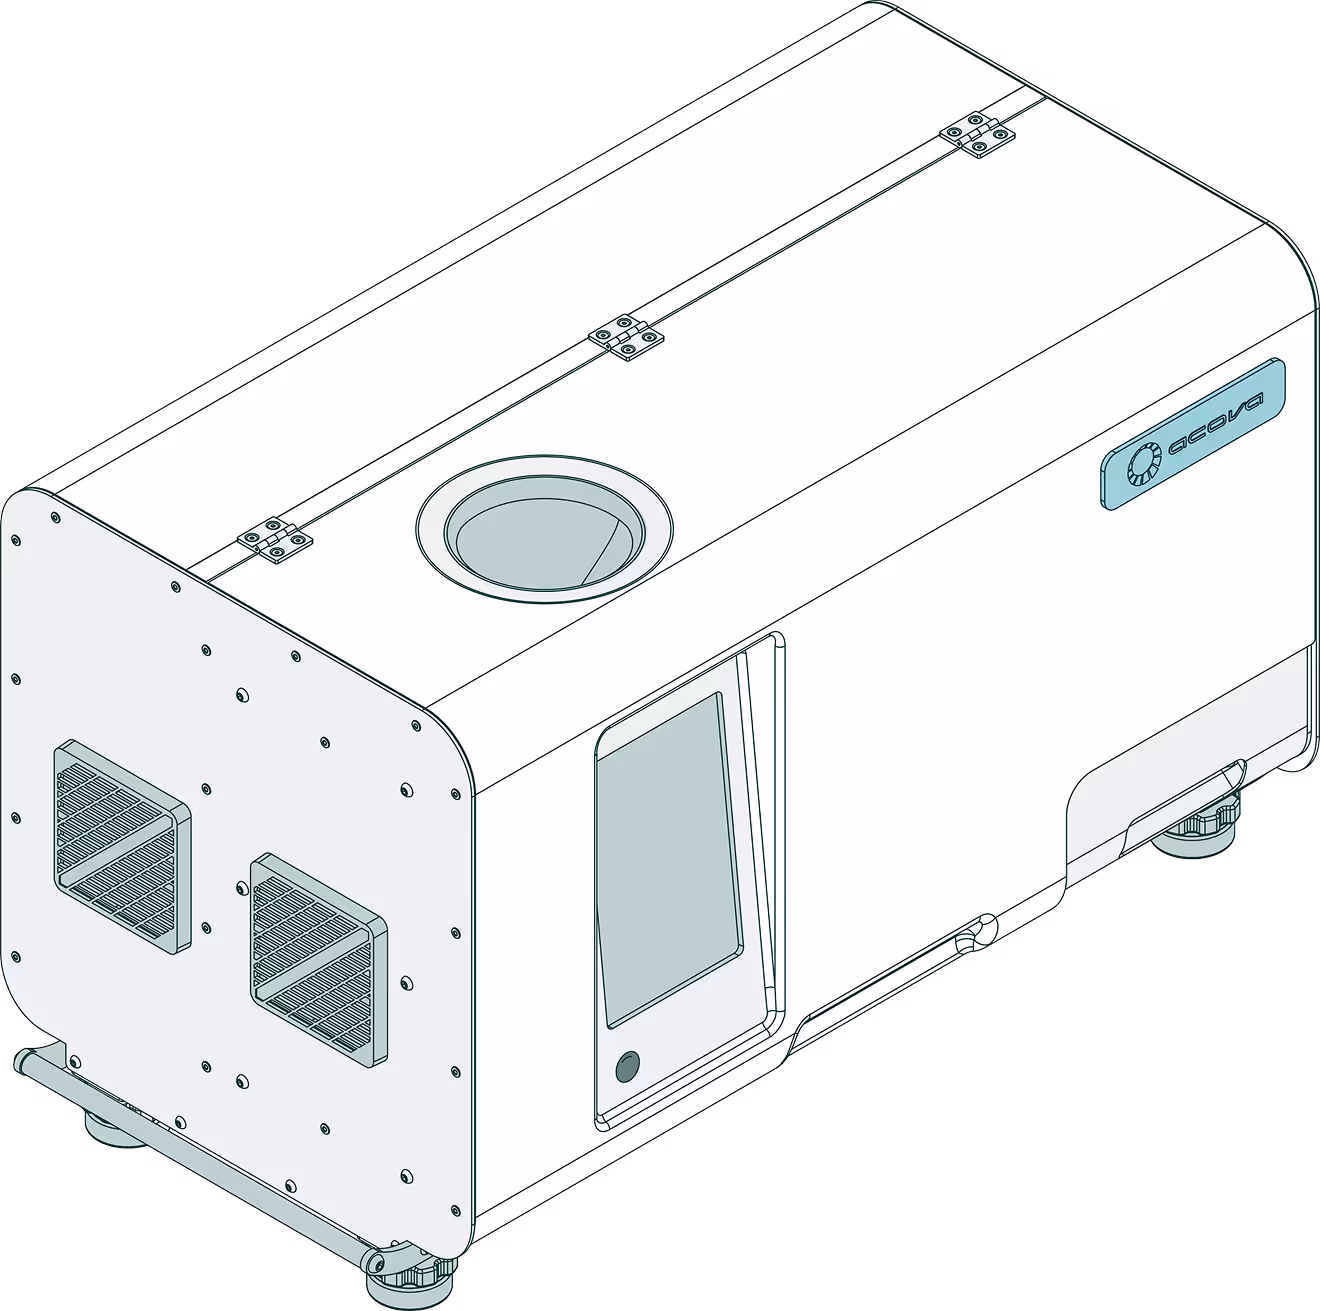
key features
Explore the Acova Device
01
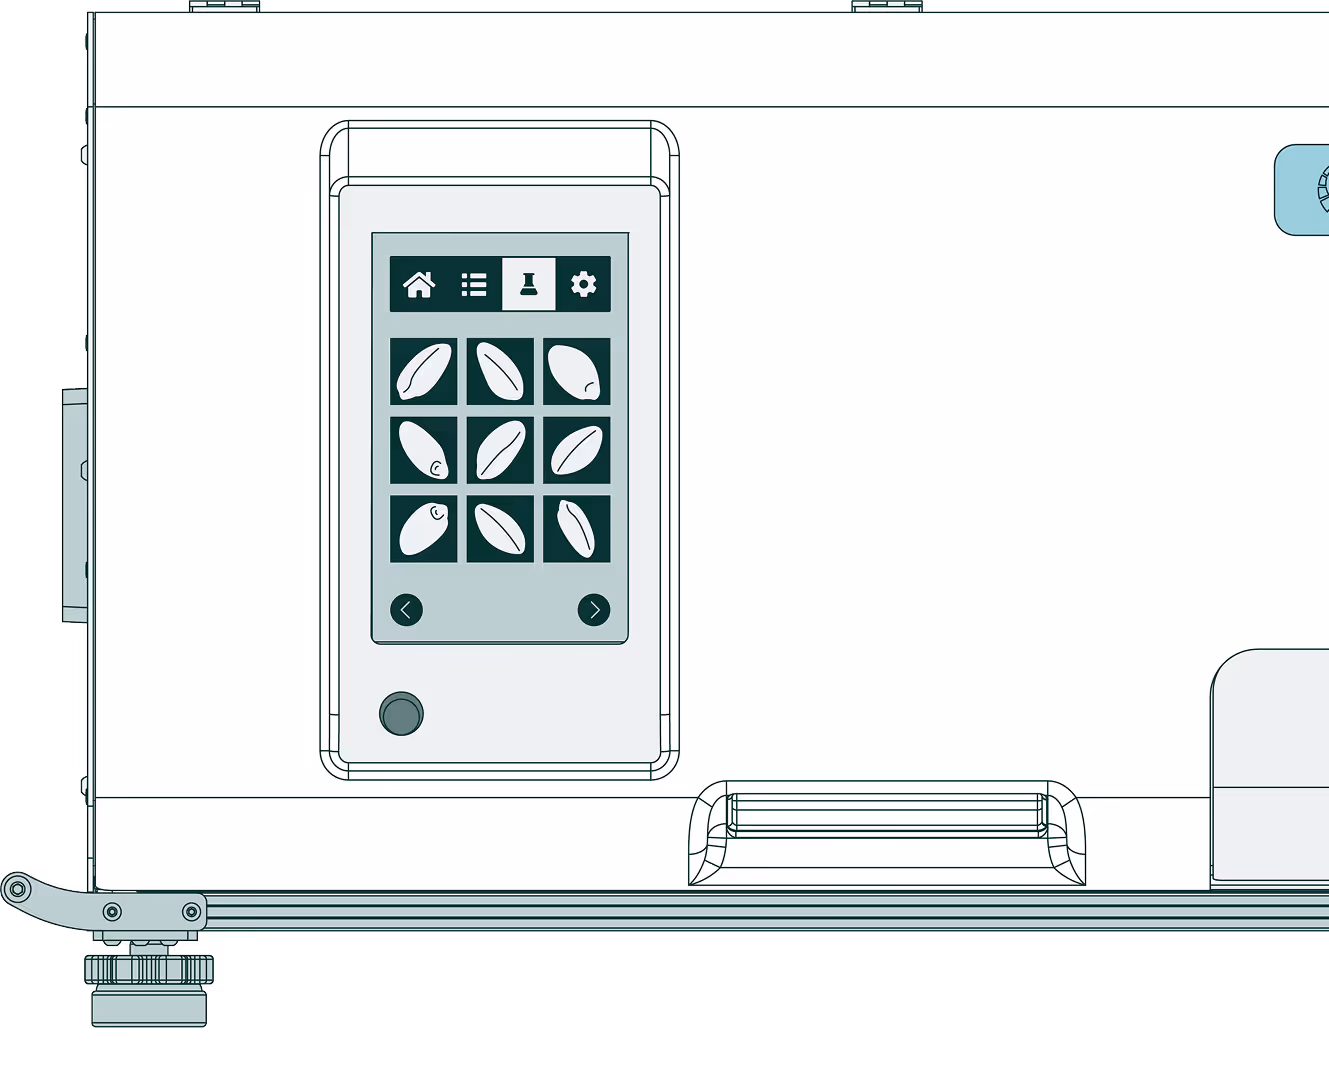
High-speed processing
Processes a full industry sample in minutes, keeping operations efficient.
02
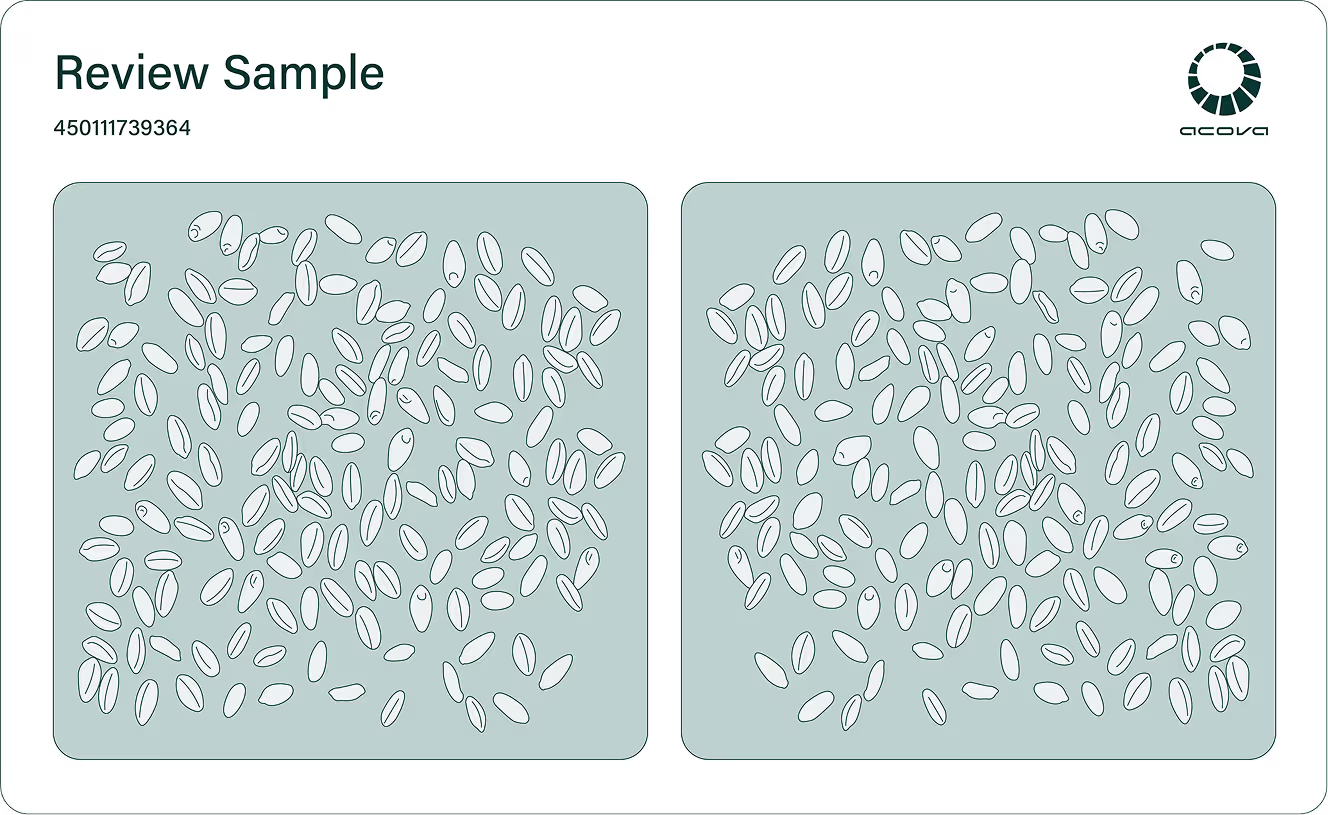
Double-sided imaging
Captures both sides of every sample, ensuring a complete and representative assessment.
03
Individual object analysis
Assesses each kernel or component independently for detailed quality insights.
04
Artificial intelligence & machine learning
Detect and classify defects accurately against digital standards, improving as more data is captured.
05
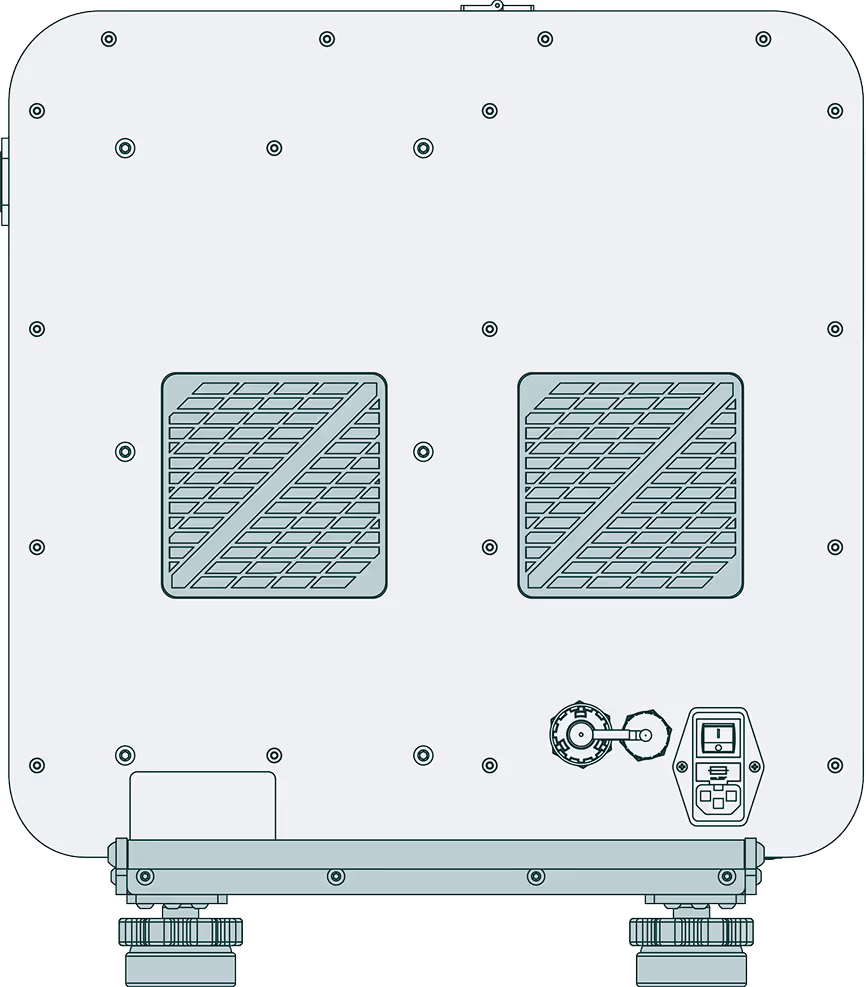
Self-cleaning
High-pressure air clears residue between samples to prevent contamination and reduce downtime.
06
Automatic calibration
The system calibrates itself before each run, maintaining accuracy without operator input.
01
High-speed processing
Processes a full industry sample in minutes, keeping operations efficient.
02
Double-sided imaging
Captures both sides of every sample, ensuring a complete and representative assessment.
03
Individual object analysis
Assesses each kernel or component independently for detailed quality insights.
04
Artificial intelligence & machine learning
Detect and classify defects accurately against trained standards, improving as more data is captured.
05
Self-cleaning
High-pressure air clears residue between samples to prevent contamination and reduce downtime.
06
Automatic calibration
The system calibrates itself before each run, maintaining accuracy without operator input.
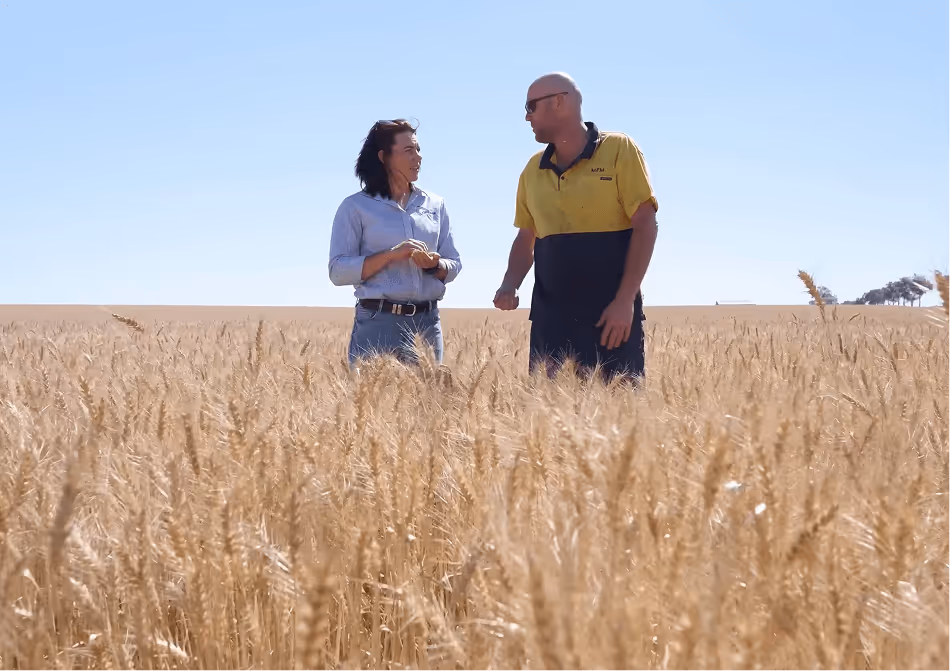
LOCATIONS
Acova in practice
Explore what commodities are supported in your region.
COMMODITIES
Active (Wheat, Barley, Oats)
In Training
Mid West
-
Binnu
Active
-
Wheat, Barley, Oats
Metro Region
-
Active
-
Wheat, Barley, Oats
Goldfields - Esperance Region
-
Active
-
Wheat, Barley, Oats
Great Southern Region
-
Active
-
Wheat, Barley, Oats
Wheatbelt Region
-
Active
-
Wheat, Barley, Oats
Adelaide
-
Trial
-
In progress
Toowoomba
-
In-Training
-
Sorghum and Chickpea

OUR INNOVATION